American Beef Export Trade Stats: May 2019
Beef Highlights:
May 2019:
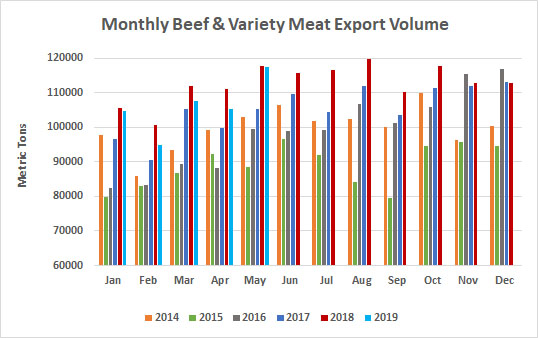
Beef: 89,696 mt, -0.1%, $645 million +0.2%
BVM: 27,845 mt, -1%, $83 million, +6%
Beef + BVM: 117,541 mt, -0.3%, $726 million, +0.8%
January – May 2019:
Beef: 399,817 mt, -3%, $2.910 billion, -1%
BVM: 130,271 mt, -2%, $393 million, +7%
Beef + BVM: 530,088 mt, -3%, $3.304 billion, -0.4%
Beef muscle cut exports were just slightly lower year-over-year in May as higher exports to Korea (+2,300 mt), Taiwan (+1,200 mt), South America (+480 mt), Mexico (+350 mt), the ASEAN (+330 mt), the EU (+130 mt), the Middle East (+100 mt) and the Caribbean + DR (+10 mt) were offset by lower exports to China/HK (-2,400 mt), Japan (-1,500 mt), Canada (-1,000 mt), Africa (-30 mt), and Central America (-5 mt). At nearly 90,000 mt, beef muscle cut exports were the highest since last October (and were the 7th highest monthly volume after five months in 2018 and July 2011; the record month was 95,000 mt last August). May beef exports to Japan totaled 24,217 mt, down 6% from last year but up 5,000 mt from April and the highest since last August. At 21,990 mt, exports to Korea were the 4th highest since BSE, were up 11% from last year, and were also the highest since last August. Exports to Mexico have continued to rebound in 2019, and in May, exports were up 3% year-over-year at 11,978 mt, but exports to Canada have been lower so far this year, with May exports down 10% at 8,852 mt. Exports to Taiwan were the third highest month on record (following August and December 2018), with exports up 27% from last year at 5,873 mt. Combined exports to China/HK continued to lag and totaled 6,690 mt, the highest so far this year but down 26% from last year. Exports to HK were 6,147 mt, down 25%, while exports to China were 543 mt, down 34% from 828 mt last May. In South America, exports to top market Chile were up 55% from last year at 1,073 mt, the highest volume since last February. In the ASEAN, exports were higher year-over-year to Indonesia (866 mt, +69%) and Vietnam (716 mt, +11%), while exports slowed to the Philippines (814 mt, -20%) and Singapore (225 mt, -7%). In the Middle East, exports to the UAE were up 13% at 467 mt, but exports to Kuwait were down 19% at 258 mt. Exports to the DR were up 7% from last year at 517 mt. Exports to the Netherlands Antilles (275 mt, +33%) were up, and exports to the Bahamas (277 mt) were steady year-over-year, but exports to Jamaica (125 mt, -47%) were lower. Exports to Guatemala had been lagging last year’s record pace, but in May, exports were up 21% from last year at 359 mt.
Like April, Japan was one of the few growth markets for U.S. BVM exports in May, but exports also increased to the Middle East and the ASEAN in May. Higher BVM exports to the Middle East (+1,300 mt), Japan (+1,200 mt), the ASEAN (+220 mt), and Central America (+60 mt) were outweighed by lower exports to Africa (-920 mt), China/HK (-618 mt), Mexico (-580 mt), Canada (-330 mt), Caribbean + DR (-220 mt), South America (-150 mt), and Korea (-30 mt). Mexico was the top destination with exports of 8,254 at the highest level since January but down 7% from last May. Exports to Egypt were 6,198 mt, up 25% from last year, but year-to-date exports still lag last year’s pace (when exports were the lowest since 2005). Exports to Japan were the highest since 2016 at 5,532 mt, up 26%. Exports to HK were 1,469 mt, -30%. BVM exports to South Africa were slow in March and April (at just 326 mt and 184 mt compared to around 1,000 mt for each of those months in 2017 and in 2018), but exports normally peak in the summer. Exports increased from their slow levels in the spring to 1,144 mt in May, but that was still down significantly (-39%) from 1,862 mt last year. In May, exports were also slower to Angola (47 mt, -82%) but were higher to Gabon (133 mt, +22%). Exports were higher to Indonesia (889 mt, +64%) but were lower to the Philippines (403 mt, -25%). In South America, exports to Peru were down 1% from last year at 699 mt but were the highest since last November. Exports to Colombia have trended lower from last year’s record levels with May exports down 52% at 156 mt, but exports were higher to Chile at 263 mt, +36%.
For January – May, total beef and bvm exports were down 17,100 mt from last year’s record. Higher exports to Korea (+9,900 mt), the ASEAN (+3,450 mt), Taiwan (+2,350 mt), the Caribbean + DR (+1,100 mt), and Central America (+260 mt) were outweighed by lower exports to China/HK (-18,800 mt), Canada (-7,000 mt), Africa (-2,600 mt), the Middle East (-1,900 mt), Mexico (-1,800 mt), the EU (-1,250 mt), South America (-410 mt), and Japan (-160 mt).
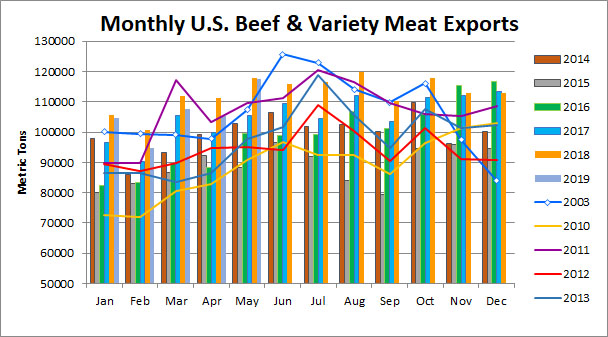
May beef exports accounted for 12.0% of production and 14.6% when adding variety meats, as compared to 12.1% and 14.8% in May 2018. For January – May, beef exports accounted for 11.3% of production and 14.0% when adding variety meats, down from 11.9% and 14.6% last year.
Note: I had a typo error in the calculations for the percentage of beef exported starting in 2017 that caused the percentages USMEF reported to be about 1.1% less than they should have been for beef and beef + bvm exported. So in 2018, a record 14.6% of beef + bvm production was exported (vs. the 13.5% that was originally reported). I apologize for this inconvenience. The chart below is also attached with the updated percentages for 2017 and 2018. Please let me know if you need any more information regarding the historical percentages of beef production that was exported.
April beef export value per head of fed slaughter averaged $312.85/head, down just $0.53/head from $313.38/head for May 2018. For January – May, beef export value per head averaged $309.33/head, down $8.36/head or -3% from $317.69/head last year.
SOURCE: USMEF