American Beef Export Trade Stats: April 2026
April 2026:
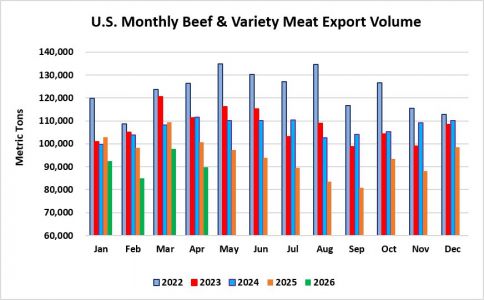
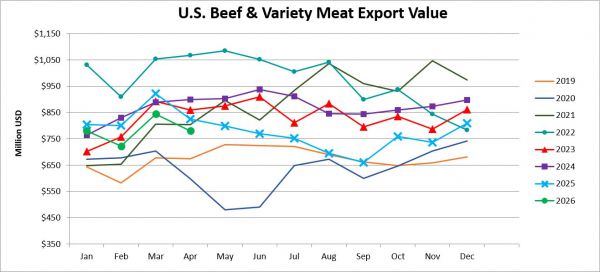
Beef: 64,469 mt, -19%; $665.9 million, -10%
BVM: 25,314 mt, +20%; $114.7 million, +40%
Beef + BVM: 89,783 mt, -11%; $780.6 million, -5%
January – April 2026:
Beef: 259,170 mt, -19% and the lowest since 2016; $2.646 billion, -12% and the lowest since 2021
BVM: 105,968 mt, +16% and the highest since 2014; $482 million, +44% and an all-time high (note that there is some misreporting on the bvm side as Jessica and Erin pointed out last week so these values are likely overstated)
Beef + BVM: 365,138 mt, -11% and the lowest since 2016; $3.128 billion, -7% and the lowest since 2021
April beef muscle cut exports totaled 64,469 mt, down 19% or -15,136 mt year-over-year and the lowest for the month of April since 2016. However, export value was just the lowest for the month of April since 2020 at $666 million, down 10%.
• Compared to the previous year, April beef muscle cut exports were higher to ASEAN (+932 mt), Caribbean + DR (+650 mt), and the EU 27 + UK (+137 mt), but exports were lower to Japan (-5,634 mt), South Korea (+4,007 mt), China/HK (-2,932 mt), Mexico (-2,427 mt), Canada (-869 mt), Middle East (-399 mt), South America (-225 mt), Central America (-153 mt), Taiwan (-102 mt), Africa (-37 mt), and CIS (-4 mt).
• U.S. beef muscle cut exports totaled 18,854 mt in April, down 18% from last year and lower than last year for the third consecutive month.
• Exports to Japan totaled 13,170 mt in April, down 30% year-over-year.
• April exports to Mexico were below year-ago levels for the thirteenth consecutive month at 6,041 mt, down 29% year-over-year and the lowest since 2020.
• April exports to Canada were lower year-over-year for the sixth consecutive month at 5,831 mt, -12%.
• December exports to Taiwan reached 5,650 mt, down 8% year-over-year but the second highest monthly volume in 2025. Exports were 4,663 mt in January, which was up 49% year-over-year, but in February, exports slowed to 3,667 mt, down 8% from last year. Exports rebounded in March to 4,635 mt, but that was down 9% from last year. April exports were 4,380 mt, down just 2% year-over-year.
• September combined exports to China/HK dropped to 3,846 mt, down 75% from 2024 or down 11,360 mt. This was the lowest combined volume since 2012. In October and November, volumes remained below 5,000 mt per month. December exports totaled 5,747 mt, down 65% year-over-year but the highest since April. In January 2026, exports adjusted down again to 4,725 mt, which was down 71% from last year. February exports totaled 5,510 mt, down 59% or -8,087 mt from last year. March exports totaled 5,144 mt, down 69% from last year or -11,275 mt. In April 2026, exports totaled 4,926 mt, the lowest since January but that was down just 37% from last year when volumes dropped initially on tariff escalation. April exports to China were just 354 mt, down 93% and the lowest since the market opened in 2017. Exports to HK were 4,592 mt in April, up 52%.
• In the ASEAN region, exports to the Philippines had been over 1,400 mt each month from April through September 2025 and were nearly 1,100 mt in October before volumes slowed at the end of the year. Volumes dropped to just 436 mt in January, but exports rebounded to 942 mt in February and held at 943 mt in March (which was down 9% year-over-year). In April, exports to the Philippines jumped to 1,256 mt, the highest since last September but down 12% from last year. Exports to Indonesia totaled 960 mt in April, up significantly from last year’s minimal levels and the highest since December. Exports to Vietnam held steady with the previous month at 502 mt, which was up 58% and the highest since last October for the second consecutive month. April exports were slightly lower than last year to Singapore (196 mt, -3%) but higher to Thailand (95 mt, +32%).
• For the Caribbean region, beef muscle cut exports to the DR have been at record levels for the last three months. Exports were 1,185 mt in April, down just a few mt from the record 1,188 mt in March. March exports to the Bahamas were the highest since 2006 at 496 mt, and April exports remained strong at 444 mt, up 37% from last year. Exports were also strongly higher to the Netherlands Antilles (325 mt, +24%), Jamaica (253 mt, +120%), and the Leeward-Windward Islands (250 mt, +92%). After rebounding to 247 mt in November 2025, exports to Cuba were just 4 mt in December and 11 mt in January. Exports were again just 4 mt in February, before increasing to 27 mt in March. In April, exports were 32 mt, down from 95 mt last April (when exports had already slowed from the big increase in 2024).
• In April, exports to Guatemala slowed from nearly 1,000 mt in both February and March to 844 mt, which was down 14% from last year but was significantly higher than other previous years. Exports were also higher to Costa Rica (449 mt, +30% and the highest since January 2025).
• Beef muscle cut exports to Peru reached a monthly record of 407 mt in April, up 20% from last year. Exports were lower to Chile (233 mt, -33%) and Colombia (287 mt, -25%).
• Exports to the UAE had rebounded in Jan and Feb (at 629 mt and 529 mt, respectively), but exports slowed to 127 mt in March and dropped to 99 mt in April, down 64% from last year. Exports to Saudi Arabia jumped to 168 mt, up 180% from last year and the highest since 2022. Exports also increased to Bahrain (109 mt, +179% and the highest since May) and Jordan (120 mt, +107% and the highest since 2021). Exports were sharply lower to most other destinations in the region, reflecting the logistics challenges and changing shipping patterns.
April beef variety meat exports were 25,314 mt, up 20% or +4,260 mt from last year. Export value was $115 million, up 40%. *USMEF has flagged that beef variety meat exports have jumped notably to Japan, South Korea, and Taiwan since Q4 2025, which does not correspond with trends for beef variety meat import data in those countries. We will provide an update on this situation when available, but for now we are reporting the data as reported by the U.S. Census Bureau.
• In April, bvm exports were higher than last year to Mexico (+1,813 mt), Japan (+822 mt), South Korea (+753 mt), Taiwan (+502 mt), China/HK (+476 mt), ASEAN (+219 mt), Middle East (+182 mt), South America (+135 mt), and Central America (+7 mt), while exports were lower to Canada (-256 mt), Africa (-224 mt), and Caribbean + DR (-176 mt).
• BVM exports to Mexico jumped to 11,755 mt in December, up 12% year-over-year and the highest since January (and otherwise the highest since 2016). Exports to Mexico remained strong at 10,968 mt in January, but that was down 8% from last year’s strong total. February exports maintained momentum at 10,100 mt, up 10% year-over-year. In March, exports surged to 12,336 mt, up 35% from last year and the highest since December 2015. In April, exports totaled 11,021 mt, up 20% from last year.
• Exports to Canada rebounded to 1,103 mt in March, which was the highest in a year. But in April, exports slowed to the lowest level since April 2024 at 499 mt, down 34% from last year.
• Volumes to Japan were over 5,000 mt each month in Q4 2025, and in January, exports increased to 6,137 mt, up 88% from last year and the highest since September 2021. Volume eased to 4,668 mt in February, the lowest since last September, but still up significantly from year-ago at +87%. In March, volumes totaled 5,993 mt, up 69% year-over-year. April exports were reported at 4,393 mt, up 23% from last year but the lowest since September.
• Exports to South Korea jumped to 1,436 mt in January, up 88% from last year, and the highest since October 2023. Exports remained strong at 1,134 mt in February, up 85%. In March, exports jumped to 1,607 mt, the highest since June 2023 and up 125% from last year. April exports were 1,352 mt, up 126%.
• Combined bvm exports to China/HK rebounded to 2,631 mt in December, up 3% year-over-year and the highest since November 2024 before slowing again to 1,787 mt in January, which was down 28% from last year. In February, exports slowed further to 1,575 mt, down 13% from last year. March exports rebounded somewhat to 2,092 mt, which was down 15% from last year. April exports totaled 2,190 mt, the highest since December and up 28% from last year (when volumes initially dropped on tariff escalation). April exports to China were 352 mt, down 28% from last year, and exports to HK were 1,838 mt, up 50% from last year and the highest since December.
• Exports to Taiwan were over 900 mt and the highest since 2000 for the second consecutive month in January at 968 mt, up from 0 mt last year. Exports slowed somewhat in February to 533 mt, but that was still up significantly from 0 mt last Feb. March exports slowed further to 443 mt, before rebounding to 512 mt in April, up from 10 mt last year. (Note that Taiwan does not report bvm imports from the U.S., and if you combine the beef and bvm reported export total to Taiwan, it tracks more closely with Taiwan’s beef import data).
• For the ASEAN region, reported exports to Indonesia slowed from an average of 227 mt per month in Q4 2025 to just 46 mt in January 2026, which was down 33% from last year. No exports to Indonesia were reported in February, down from 379 mt last year, but exports totaled 88 mt in March, up from 71 mt last March. Exports to Indonesia increased to 155 mt in April, the highest since last December and up from 0 mt last year. April exports to Vietnam increased to 211 mt, up 503% from last year and the highest since October 2024. April exports to Philippines were 136 mt, down 32% from last year.
• In South America, exports to Peru rebounded to 756 mt in December, up 42% year-over-year and the highest since October 2024. In January, exports slowed again to 421 mt, but that was up 48% from last year. February exports were again higher year-over-year at 503 mt, up 227%. March exports were 329 mt, but that was up 191% from last year as exports were sluggish in early 2026. April exports were 434 mt, up 136% from last year. In April, exports to Chile were 293 mt, up 17%.
• Exports to Jamaica were 105 mt in April, down 35% year-over-year and below year-ago levels for the fourth consecutive month.
• In 2025, bvm exports to Egypt were down just 1% year-over-year at nearly 38,000 mt. In December 2025, exports totaled 3,532 mt, up 46% year-over-year and the highest since January. But in January 2026, exports slowed to 3,210 mt, which was down 20% from last year’s relatively large total. February exports to Egypt slowed further to 2,962 mt, down 11% from last year, while March exports were 2,846 mt, down 9%. April exports slowed to 2,658 mt, the lowest since last May but up 7% from last year.
• Negligible volumes of bvm were shipped to South Africa from Q4 of 2024 through August 2025, and no exports were reported in June or July 2025. Exports of 132 mt were reported in August, and exports of 136 mt were reported in September. In Q4 2025, exports averaged 265 mt per month and reached 312 mt in December, which was the highest since September 2024. Exports increased further to 512 mt in January 2025, the highest since July 2024 and up from just 49 mt last January. Exports slowed to 290 mt in February and 233 mt in March, up from just 0 mt and 24 mt last year, respectively. In April, exports totaled 275 mt, up from 0 mt last year.
• Exports to Morocco jumped to 460 mt in February with the new duty-free quota year, similar to exports last Feb of 476 mt, and in March, exports to Morocco were 351 mt, down 43% from last year. April exports were 209 mt, down 11%. March exports to Cote d’Ivoire rebounded to 352 mt, the highest since July but down 34% from last year, while April exports to Cote d’Ivoire were 212 mt, down 58%.
January – April beef muscle cut + variety meat exports totaled 365,138 mt, down 11% or -45,889 mt from 2025. Exports were higher year-over-year to Taiwan (+3,097 mt), ASEAN (+2,641 mt), Caribbean + DR (+901 mt), South America (+832 mt), EU 27 + UK (+553 mt), and Mexico (+323 mt). Exports were lower to China/HK (-34,662 mt), Japan (-7,262 mt), South Korea (-5,191 mt), Canada (-3,856 mt), Middle East (-2,218 mt), Africa (-897 mt), Central America (-64 mt), and CIS (-6 mt).
April 2026 beef exports accounted for 9.6% of production and 12.5% when adding variety meats, compared to 11.1% and 13.1% in April 2025. January – April 2026 beef exports accounted for 9.8% of production and 13.0% when adding variety meats, compared to 11.4% and 13.6% for January – April 2025.
April 2026 beef export value per head of fed slaughter averaged $415.88/head, up 5% or +$19.17/head from $396.71/head in April 2025. January – April 2026 beef export value per head of fed slaughter averaged $427.59/head, up 3% or +$12.44/head from $415.16/head for January – April 2025.
Source: USMEF