U.S. Beef Production and Price in May
See below for highlights from the Livestock Slaughter, Cold Storage, and Cattle on Feed Reports.
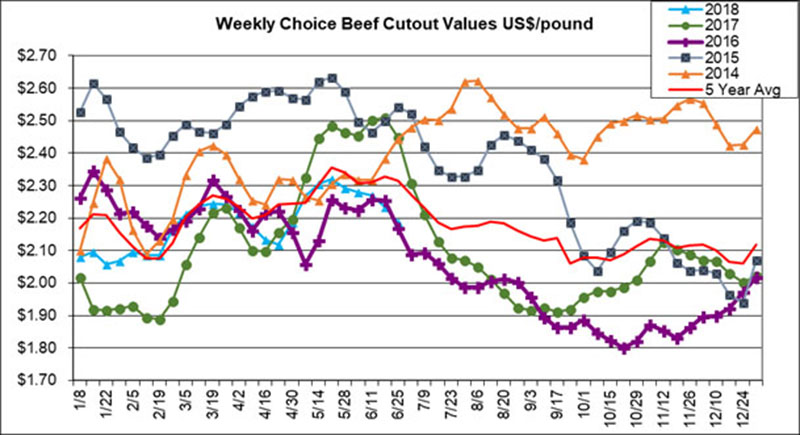
The Choice cutout again moved lower and was down 2% or -5 cents/lb. to $2.19/lb., the lowest in 2 months. The Select cutout was down slightly at $2.02/lb. with the Choice/Select spread at $16.41/cwt as the difference between Choice and Select prices continued to narrow from its seasonal peak five weeks ago. For the Choice Primals, chucks and rounds held steady while the other primals moved lower. Briskets, short plates, and flanks all dropped 1% week-over-week, while ribs and loins were down 4%. The upcoming 4th of July holiday is the last big grilling holiday in the early summer (along with Memorial Day and Father’s Day), and it is a big holiday for burgers. According to Urner Barry, bottom rounds found support from ground beef processing demand, with processors gearing up for retail features for the holiday. 50% beef trim prices continued to move lower this week, down 6% or -4 cents/lb. from last week to $0.65/lb. Weekly estimated beef production was 528.1 million pounds, up 1.7% from last week and up 3.2% from last year. Year to date production is up 3.6% 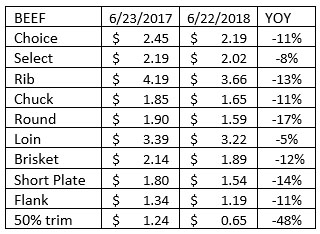 from last year with slaughter up 3.1%. Weekly slaughter was 664,000 head, up 1.5% from last week and up 3.9% from last year. Live weights were 1,316 lbs., up 1 lb. from last week but down 8 lbs. from last year. Dressed weights were 797 lbs., up 1 lb. from last week but down 6 lbs. from last year. After moving slightly lower last week, steer prices were down 4% or -$4/cwt from last Friday at $109.67/cwt. Futures contracts were up from last Friday: June: $108.28 (+$2.03), August: $105.90 (+$4.02), and October: $109.40 (+$4.60).
Prices in USD/lb., from USDA/AMS, FOB plant, primals are Choice values
Record High Red Meat and Pork Production for May
May 2017 contained 23 weekdays (including 1 holiday) and 4 Saturdays.
May 2018 contained 23 weekdays (including 1 holiday) and 4 Saturdays.
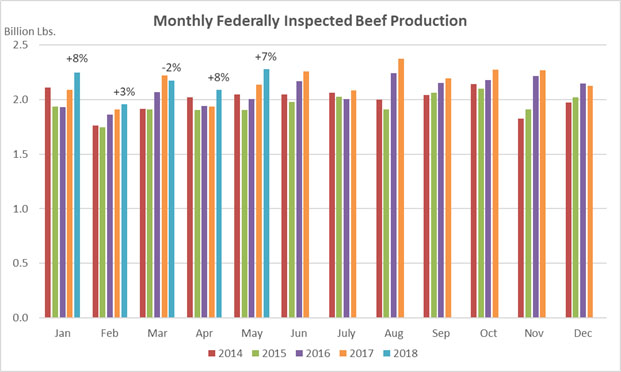
Commercial red meat production for the United States totaled 4.50 billion pounds in May, up 5 percent from the 4.28 billion pounds produced in May 2017.
Beef production, at 2.31 billion pounds, was 7 percent above the previous year. Cattle slaughter totaled 2.91 million head, up 6 percent from May 2017. The average live weight was up 8 pounds from the previous year, at 1,315 pounds.
 Veal production totaled 6.4 million pounds, 1 percent above May a year ago. Calf slaughter totaled 46,400 head, up 18 percent from May 2017. The average live weight was down 38 pounds from last year, at 237 pounds.
January to May 2018 commercial red meat production was 21.9 billion pounds, up 4 percent from 2017. Accumulated beef production was up 4 percent from last year, veal was up 1 percent, pork was up 4 percent from last year, and lamb and mutton production was up 6 percent.
(Source: USDA/NASS, note that charts show FI production but text from report references commercial production)
Cold Storage
Total red meat supplies in freezers were down 2 percent from the previous month but up 9 percent from last year. Total pounds of beef in freezers were down 1 percent from the previous month but up 13 percent from last year. Frozen pork supplies were down 2 percent from the previous month but up 6 percent from last year. Stocks of pork bellies were down 5 percent from last month but up 94 percent from last year.
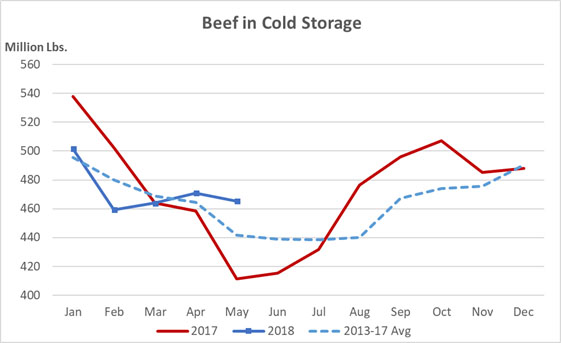 Beef in cold storage totaled 465.4 million pounds in May, up 13% from 411.5 million pounds in May 2017 and down 1% from the previous month. Beef in cold storage was up 5% from the previous 5-year average.
Boneless beef up 13% from last year, down 2% from last month
Beef cuts up 11% from last year, up 7% from last month.
Source: USDA/NASS
United States Cattle on Feed Up 4 Percent
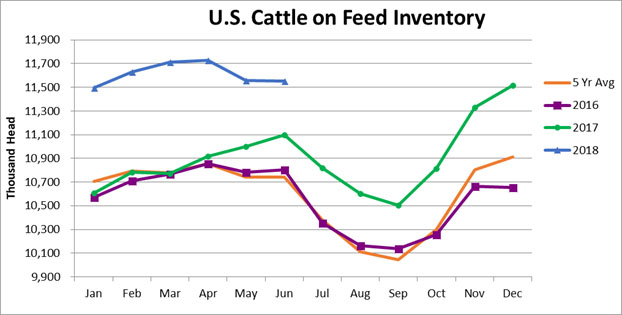
Cattle and calves on feed for the slaughter market in the United States for feedlots with capacity of 1,000 or more head totaled 11.6 million head on June 1, 2018. The inventory was 4 percent above June 1, 2017 and 8 percent above the previous 5-year average. This is the highest June 1 inventory since the series began in 1996.
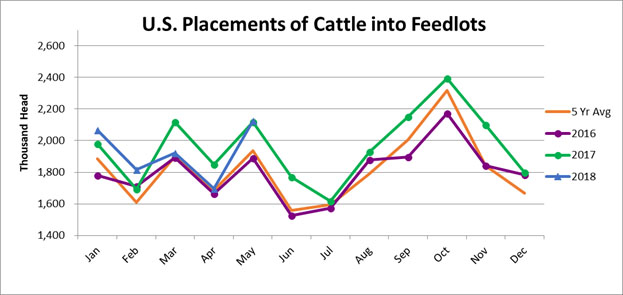
Placements in feedlots during May totaled 2.12 million head, slightly above 2017 and up 10 percent from the previous 5-year average. Net placements were 2.05 million head. During May, placements of cattle and calves weighing less than 600 pounds were 445,000 head, 600-699 pounds were 340,000 head, 700-799 pounds were 480,000 head, 800-899 pounds were 524,000 head, 900-999 pounds were 235,000 head, and 1,000 pounds and greater were 100,000 head.
Marketings of fed cattle during May totaled 2.06 million head, 5 percent above 2017 and 11 percent above the previous 5-year average.
Other disappearance totaled 73,000 head during May, 4 percent above 2017.


Notes: The cattle on feed inventory exceeded analysts’ expectations. Before the report, analysts expected the number of cattle on feed to be up 3.4%, compared to the actual increase of 4.1%. As noted above, the inventory was the highest for June since the series began in 1996. Marketings were in line with pre-report expectations at 5%, but placements were higher than expected. The analyst average was for placements to be down 4.2%, but placements were up 0.2% (within the high-end of the analyst estimate range of +0.8%).
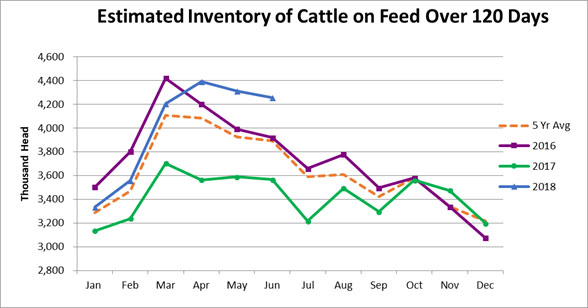
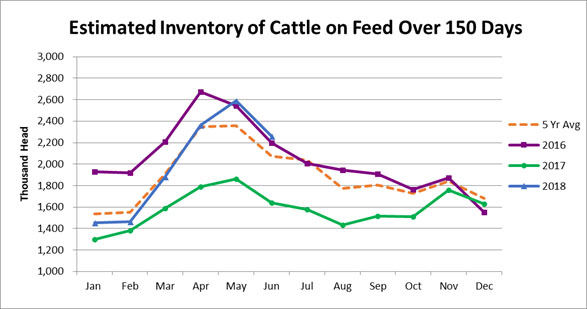
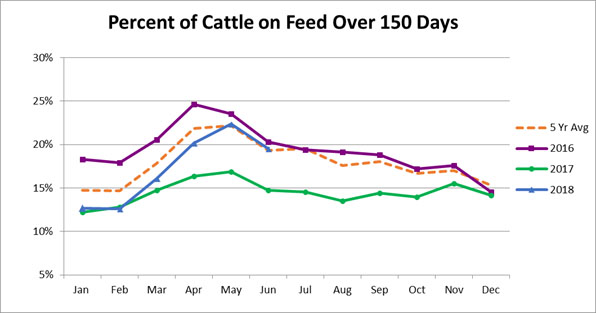
The estimated inventory of cattle on feed over 120 days was up 19.3% from last year and up 9.3% from the previous 5-year average (as compared to being up 20.2% and 9.8% in May). The estimated inventory of cattle on feed over 150 days was up 37.8% from last year and up 9% from the previous 5-year average (as compared to being up 39.2% and 8.6% in May). But, the percentage of cattle on feed over 120 and over 150 days is similar to the previous 5-year average (see charts below).
Marketings have been robust on strong retail and foodservice demand, and for May, the ratio of marketings to the total cattle inventory was 17.8% up slightly from 17.7% last year and up from the previous 5-year average of 17.3%.
SOURCE: USMEF